OCI FortiGate HA Cluster – Reference Architecture: Code Review and Fixes
Introduction OCI Quick Start repositories on GitHub are collections of Terraform scripts and configurations provided by Oracle. These repositories ... Read More
Learn more about why Eclipsys has been named the 2023 Best Workplaces in Technology and Ontario, Certified as a Great Place to Work in Canada and named Canada’s Top SME Employer!
Learn more!
Since the very beginning, everyone was introduced to Cloud Services through the console as it’s very quick. But the cloud CLI tooling provides a stronger, yet user-friendly way to automate tasks, often covering features not even available in the console. Moreover, DBAs often assume that the CLI is primarily designed for managing compute-based services, overlooking its potential benefits for their database fleet. In this tutorial, we’ll demonstrate how to automate the Data Guard association of your database between two Exadata Cloud at Customer infrastructures in separate regions.
On top of it, I’ll show you where to look and the type of logs that are generated if you need to troubleshoot.
REST API Endpoint
Obviously, the Rest APIs provided by the Cloud platform are the core vehicle that allows anything (infrastructure resource, or cloud services) to be created, deleted, or managed. This is why the best thing to explore a new feature is to check the REST API Endpoint. In our case the endpoint is
CreateDataGuardAssociation
POST /20160918/databases/{databaseId}/dataGuardAssociations
You can check more details here CreateDataGuardAssociationDetails
Below are the configuration details for creating a Data Guard association for an ExaCC VMCluster Database
The attributes are as below
| Attributes | Required | Description | Value |
|---|---|---|---|
| creation type | Yes | Other Options: WithNewDbSystem, ExistingDbSystem | ExistingVmCluster |
| databaseAdminPassword | Yes | The admin password and the TDE password must be the same. | |
| isActiveDataGuardEnabled | No | True if active Data Guard is enabled. | True |
| peerDbUniqueName | No |
|
Defaults to <db_name>_<3 char>_<region-name>. |
| peerSidPrefix | No | DB SID prefix to be created. | unique in the VM cluster instance # is auto-appended to the SID prefix |
| protectionMode | Yes | MAXIMUM_AVAILABILITY MAXIMUM_PERFORMANCE MAXIMUM_PROTECTION |
MAXIMUM_PERFORMANCE |
| transportType | Yes | SYNC ASYNC FASTSYNC |
ASYNC |
| peerDbHomeId | No | Supply this value to create a standby DB with an existing DB home | |
| databaseSoftwareImageId | No | The database software image OCID |
Here is a basic API call example for a Database System which slightly differs from the Exadata Cloud Implantation.
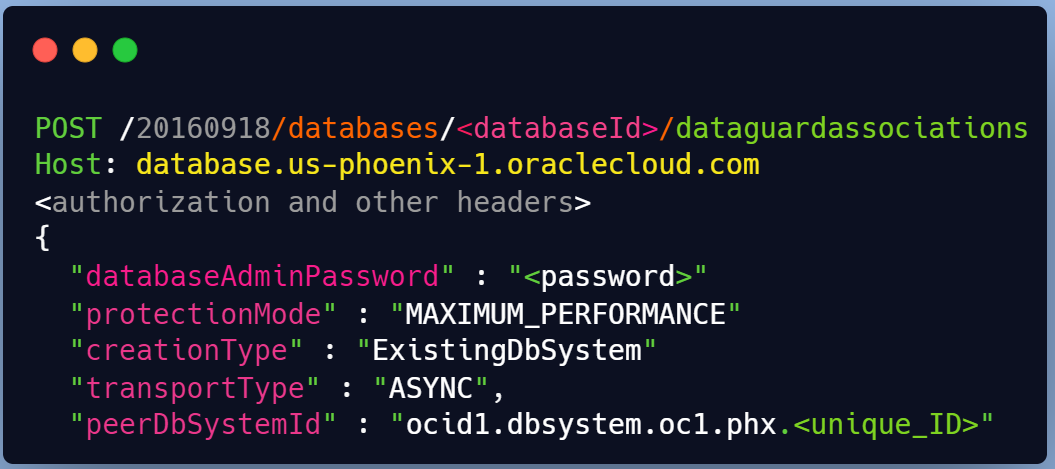
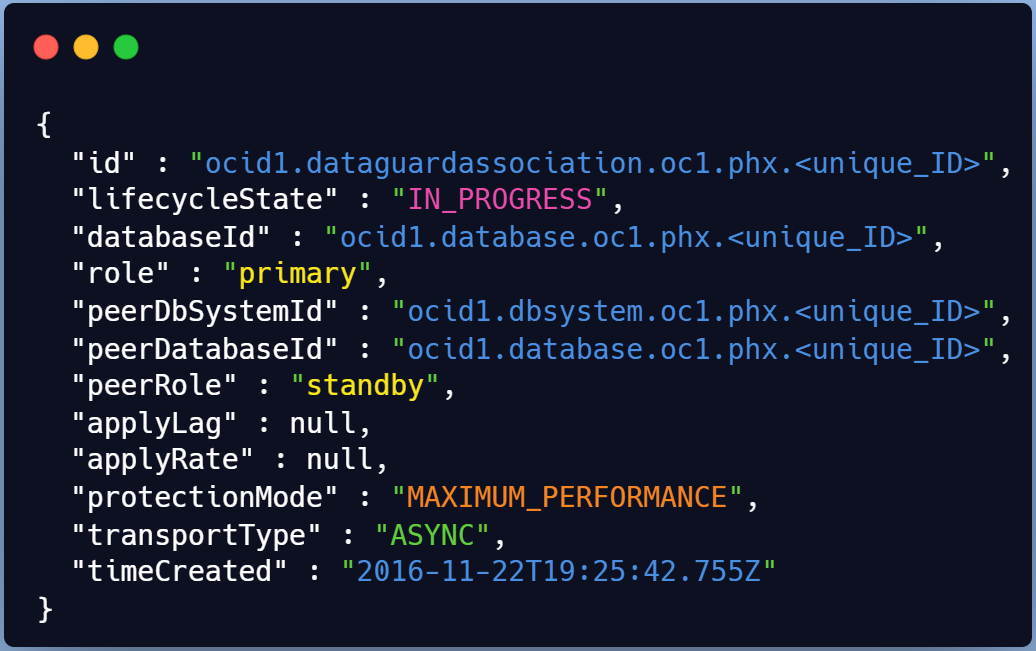
The response body will contain a single DataGuardAssociation resource.
Now that we’ve explored the REST API structure, we can move to a practical example using OCI CLI. Both Exada Cloud@Customer (Edge DB service) are located in different regions in Canada in 2 DataCenters.
$ oci db data-guard-association create from-existing-vm-cluster [OPTIONS]
Generate a sample JSON file to be used with this command option.
The best way to leverage OCI CLI with a complex structure is to generate a full command JSON construct.
# oci db data-guard-association create from-existing-vm-cluster \
--generate-full-command-json-input > dg_assoc.json
{
  "databaseAdminPassword": "string",
  "databaseId": "string",
  "databaseSoftwareImageId": "string",
  "peerDbHomeId": "string",
  "peerDbUniqueName": "string",
  "peerSidPrefix": "string",
  "peerVmClusterId": "string",
  "protectionMode":"MAXIMUM_AVAILABILITY|MAXIMUM_PERFORMANCE|MAXIMUM_PROTECTION"
,"transportType": "SYNC|ASYNC|FASTSYNC"
}
Here we will configure a Data guard setup from an ExaC@C site to another with no existing standby DB Home.
# vi dg_assoc_MYCDB_nodbhome.json
{
 "databaseAdminPassword": "Mypassxxxx#Z",
"databaseId": "ocid1.database.oc1.ca-toronto-1.xxxxx",   <--- primary DB
"databaseSoftwareImageId": null,
"peerDbHomeId": null,
"peerDbUniqueName": "MYCDB_Region2",   <--- Standby DB
"peerSidPrefix": "MYCDB",
"peerVmClusterId": "ocid1.vmcluster.oc1.ca-toronto-1.xxxxxx", <--- DR cluster
"protectionMode": "MAXIMUM_PERFORMANCE",  "transportType": "ASYNC",  "isActiveDataGuardEnabled": true
}
Now we can run the full command with the adjusted JSON template
# oci db data-guard-association create from-existing-vm-cluster \
     --from-json  file://dg_assoc_MYCDB_nodbhome.json
Right after the run, you’ll have the provisioning starting and the work request assigned
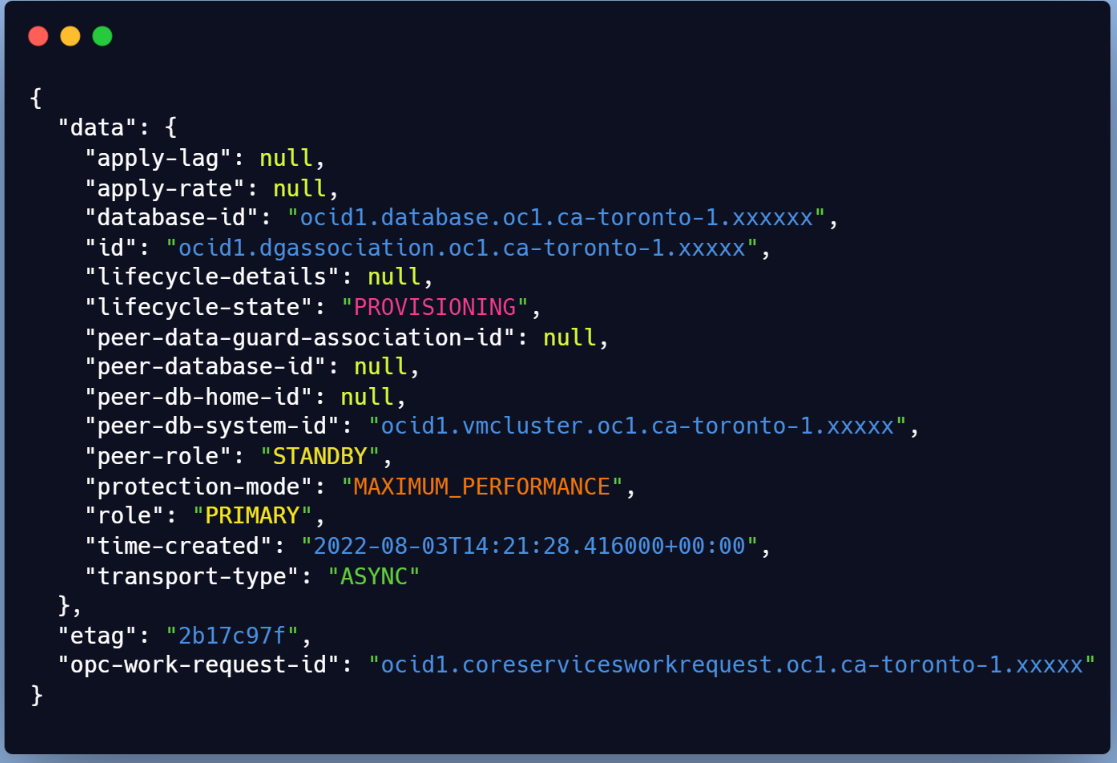
You will need the ID to check the status (Check for SUCCESS or FAILURE)
# export workreq_id=ocid1.coreservicesworkrequest.xxxxx
# oci work-requests work-request get --work-request-id $workreq_id \
 --query data.status
Automating tasks with CLI provides the advantage of not leaving you in the dark when things go awry. Here are some valuable troubleshooting insights when using OCI CLI:
The work request status and error detail are easily accessible using the get command for troubleshooting
API-based operations on existing systems like DB replications, offer comprehensive logs that are invaluable for diagnosing issues inside the target servers (For example: Exadata Cloud VM clusters).
Oracle Data Guard Association ensures clean rollbacks for quick retries in case of failures – a significant advantage over manual cleanup which we all hated back in on-premises setups.
The very first thing to check is the status of the request and the details of the error in case of failure.
Even without a work request ID, the below query allows you to list all previous data guard association jobs
# oci work-requests work-request list -c $comp_id –-query \
data[?\"operation-type\"=='Create Data Guard'].\
{status:status,operation:\"operation-type\",percent:\"percent-complete\",
\"workreq_id\":id}" --output table
The output will look like the below

Do you want to display details about the error? Sure there is an OCI Command for that
# oci work-requests work-request-error list --work-request-id $workreq_id –all \
--query "data[].[code,message]" --output table
You can see a few insights on the stage where your DG association failed for instance

When a database-related operation is performed on an ExaC@C VM, log files from the operation are stored in subdirectories of /var/opt/oracle/log.
Check Logs
Running the below find command while your Data Guard association is running can help you list the modified logs
$ find $1 -type f -print0 | xargs -0 stat --format '%Y :%y %n'| sort –nr \
| cut -d: -f2- | head
let’s see what logs are created on the primary side
☆ dg folder
This will likely contain the below files.
$ ls /var/opt/oracle/log/GRSP2/dbaasapi/db/dg
dbaasapi_SEND_WALLET_*.log
dbaasapi_CONFIGURE_PRIMARY_*.log
dbaasapi_NEW_DGCONFIG_*.log
dbaasapi_VERIFY_DG_PRIMARY_*.log
dbaasapi_SEND_WALLET_*.log
First file created is {log_dir}/<Database_Name>/dbaasapi/db/dg/dbaasapi_VERIFY_DG_PRIMARY*.log
$ tail -f dbaasapi_VERIFY_DG_PRIMARY_2022-05-27_*.log
...
Command: timeout 3 bash -c 'cat < /dev/null > /dev/tcp/clvmd01.domain.com/1521' Exit: 124 Command has no output
ERROR: Listener port down/not reachable on node: clvmd01.domain.com:1521
...
The below excerpt shows the precheck step that failed, which was fixed by running the OCI CLI Command again
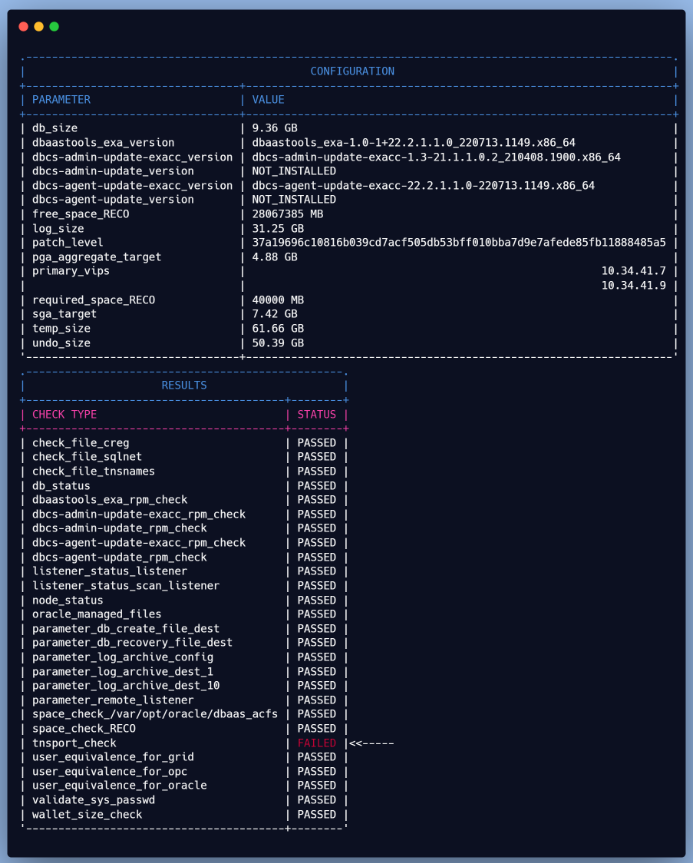
After the second run, the prechecks passed, but now there’s an issue with the primary configuration (see below).
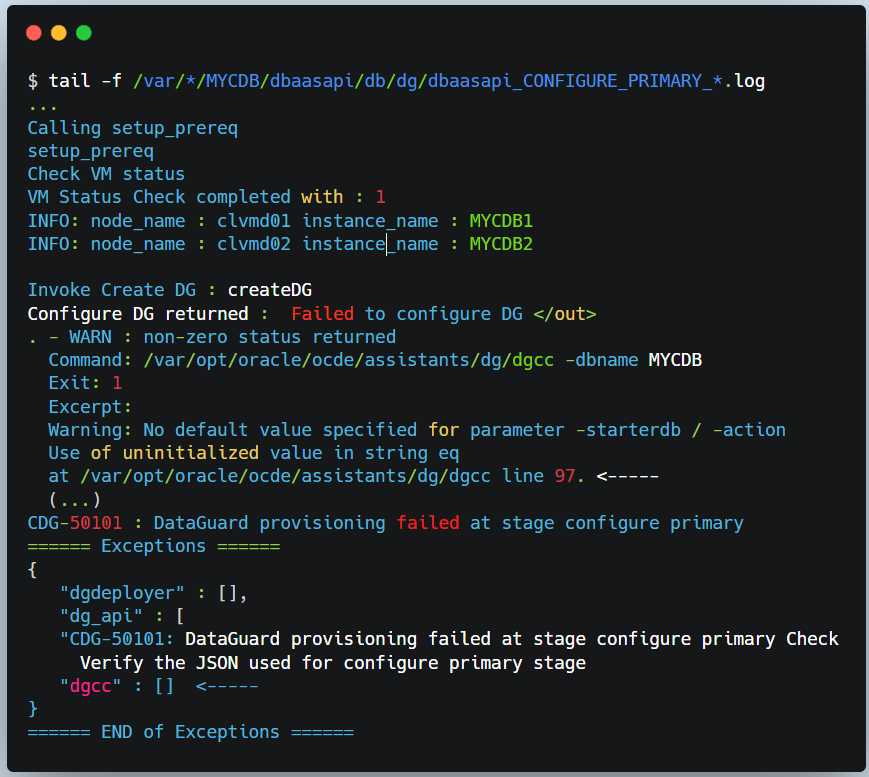
Let’s dig a bit deeper, but it seems it’s related to some service not being able to start.
☆ DGCC Folder
“DGCC” represents the Data Guard Configuration Checker, which is responsible for checking the Data Guard status and configurations. The below logs contain information about the activities and status of DGCC on the ExaC@C
$  ls /var/opt/oracle/log/MYCDB/dgcc
dgcc_configure-sql.log
dgcc_configure-cmd.log
dgcc_configure.log
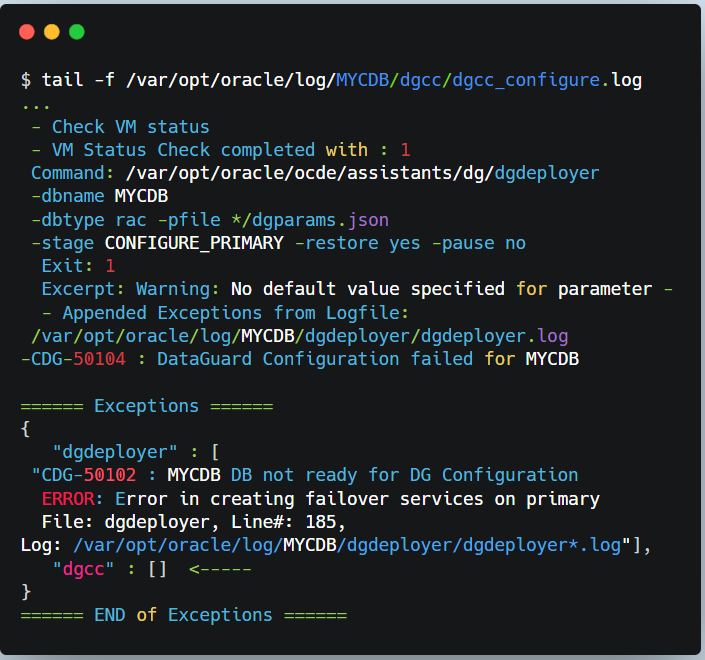
☆ DGdeployer Folder
DGdeployer, is the process that performs the DG configuration. The dgdeployer.log file should contain the root cause of a failure to configure the primary database mentioned earlier.
$  ls /var/opt/oracle/log/MYCDB/dgdeployer
 dgdeployer.log
dgdeployer-cmd.log
As displayed here, we can see that the PDB service failed to start
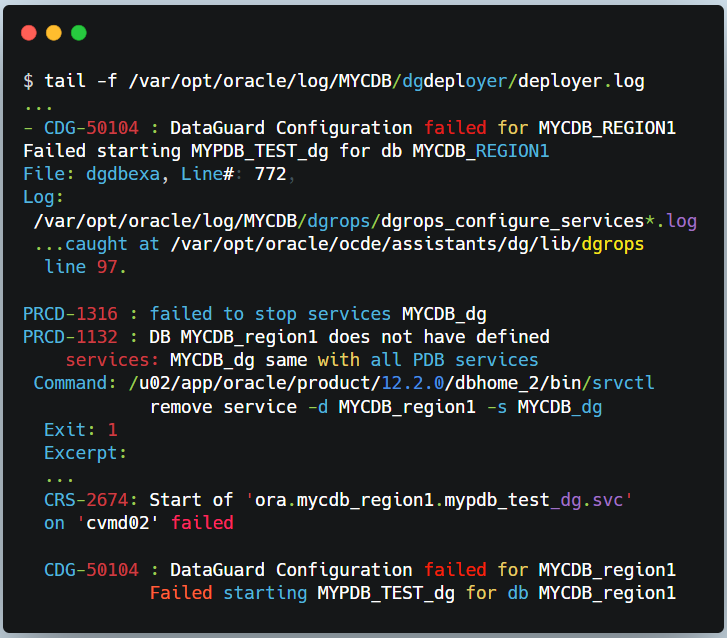
☆ DGrops Folder
The DGrops log file contains the output of the DGrops Scripts, which includes the steps performed, the commands executed, and any errors or warnings encountered. This log helped identify the issue which was that the PDB state wasn’t saved in the primary CDB.
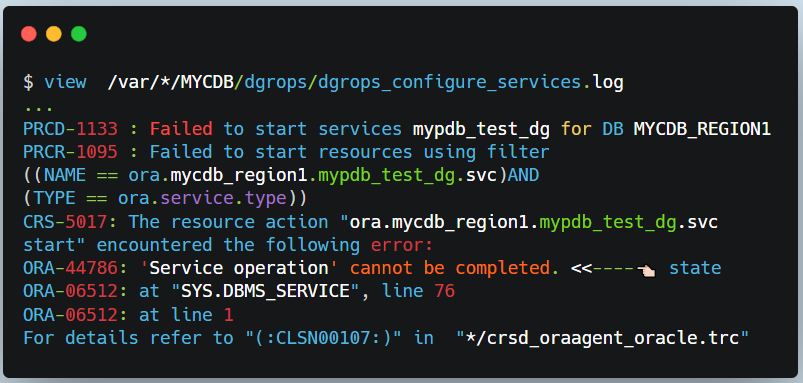
On the primary CDB, restart the PDB and save its state, and voila. The DG Association should now be successful.
$ alter pluggable database MYPDB_TEST close instances=all;
$ alter pluggable database MYPDB_TEST open instances=all;
$ alter pluggable database MYPDB_TEST save state instances=all;
At this point, there are no troubleshooting steps left. But I thought I’d add a list of available logs at the DR site.
☆ Prep Folder
This will store logs about the preparation of the standby including creating the DB home based on our previous example
$ view /var/opt/oracle/log/MYCDB/prep/prep.log
☆ DG Folder
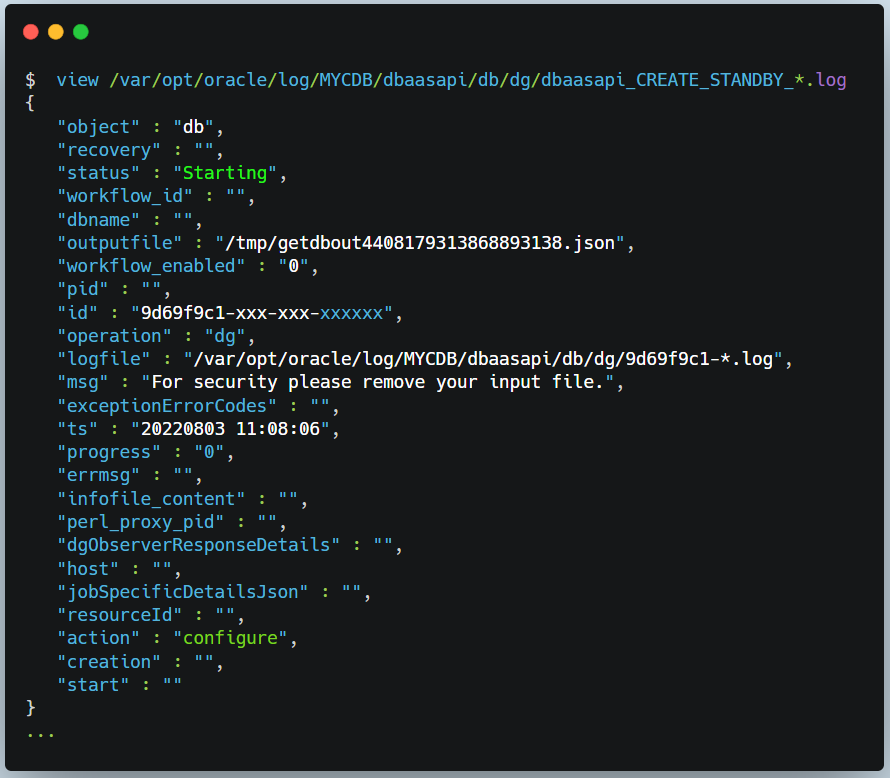
This folder will include logs pertaining to the standby database creation as shown below
$ view /var/opt/oracle/log/MYCDB/dbaasapi/db/dg/dbaasapi_CREATE_STANDBY_*.log
In this tutorial, we learned to…
Introduction OCI Quick Start repositories on GitHub are collections of Terraform scripts and configurations provided by Oracle. These repositories ... Read More
Introduction So far, I have used Oracle AutoUpgrade, many times in 3 different OS’. Yet the more you think you’ve seen it all and reached the ... Read More