How to Import Custom Visualization in Oracle Analytics Cloud to See Images
In this blog, I will show you how to download and import the Image Gallery Plugin into OCI Oracle Analytics Cloud. using this plugin we can see ... Read More
Learn more about why Eclipsys has been named the 2023 Best Workplaces in Technology and Ontario, Certified as a Great Place to Work in Canada and named Canada’s Top SME Employer!
Learn more!The purpose of this blog is to show you how to use custom metric if you don’t see the default metric available in OCI for any particular case or even if you see the default metric but you need the metric output to work your way 🙂
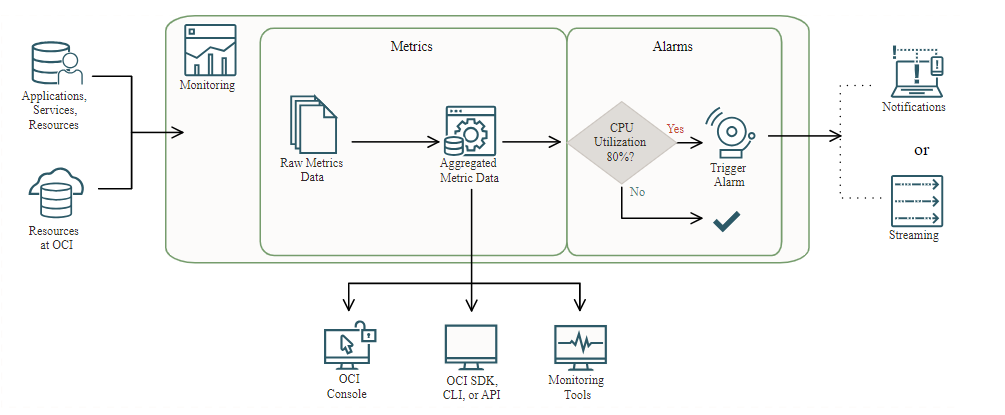
I am creating this custom metric to monitor FRA free space but as I said you can use any query to create a custom metric for any other purpose if you know the process.
Should have an environment with Python, OCI, and OracleDB drivers installed. See my previous blog for this.
A. Preparation Steps:
B. Post custom Metric data to OCI:
Login to the OCI console and add the API key to your user
Go to Profile -> my profile –> API keys –> Add API key
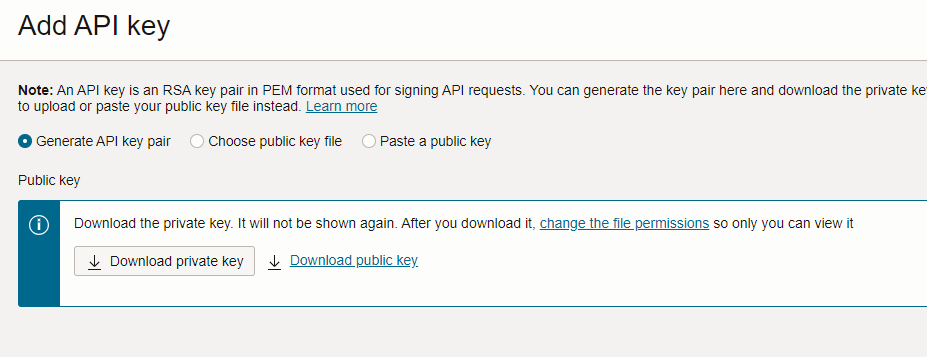
Download private key and public key files to the server from where you want to connect and click Add.
We will see the configuration file preview like this
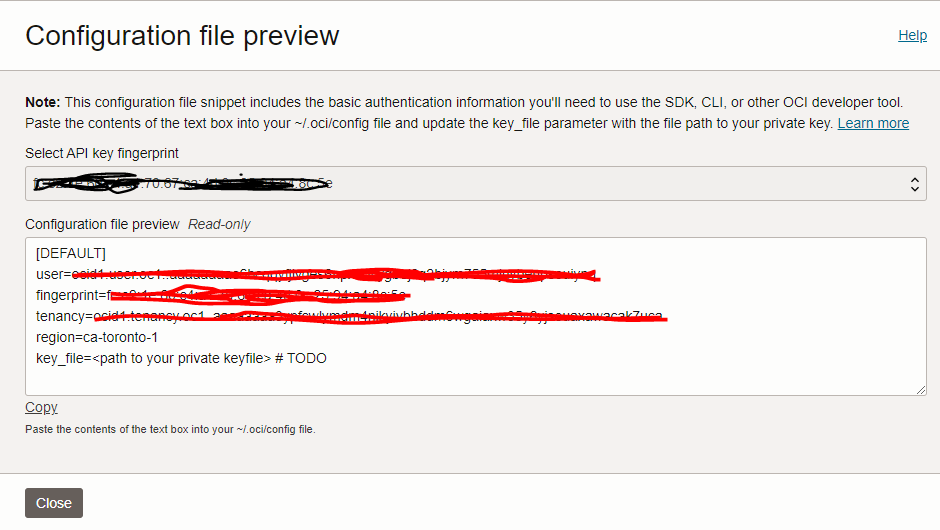
Click copy and save the text in a configuration file.
for Linux: /home/<user_name>/.oci/config
Make sure to add the private key file patch we downloaded above.
#!/usr/lib/python3.6
import oci,subprocess,os,datetime
from pytz import timezone
import oracledb
import os

oracledb.init_oracle_client()

# using default configuration file (~/.oci/config)
from oci.config import from_file
config = from_file()

# initialize service client with default config file
monitoring_client = oci.monitoring.MonitoringClient(config,service_endpoint="https://telemetry-ingestion.ca-toronto-1.oraclecloud.com")

db_user = os.environ.get('DBAAS_USER_NAME', 'SYSTEM')
db_password = os.environ.get('DBAAS_USER_PASSWORD', '*******************')
db_connect = os.environ.get('DBAAS_DEFAULT_CONNECT_DESCRIPTOR', "ip address:1521/orcl_pdb1")

# Connect to database
connection = oracledb.connect(user=db_user, password=db_password, dsn=db_connect)
cursor = connection.cursor()

# get the FRA free space data

cursor.execute("""SELECT (CASE WHEN PERCENT_USED> 100 THEN 0 ELSE (100-PERCENT_USED) END) PERCENT_FREE
  FROM (SELECT (SUM(PERCENT_SPACE_USED)-SUM(PERCENT_SPACE_RECLAIMABLE)) PERCENT_USED
  FROM V$FLASH_RECOVERY_AREA_USAGE)""")

result = cursor.fetchall()

res = float(result[0][0])
print(res)

cursor.close()
connection.close()

times_stamp = datetime.datetime.now(timezone('UTC'))

# post custom metric to oci monitoring
# replace "compartment_ocid“ string with your compartmet ocid

post_metric_data_response = monitoring_client.post_metric_data(
    post_metric_data_details=oci.monitoring.models.PostMetricDataDetails(
        metric_data=[
            oci.monitoring.models.MetricDataDetails(
                namespace="custom_metrics",
                compartment_id="compartment ocid",
                name="FRA_free_space",
                dimensions={'DB_name': 'orcl_pdb1'},
                datapoints=[
                    oci.monitoring.models.Datapoint(
                        timestamp=datetime.datetime.strftime(
                            times_stamp,"%Y-%m-%dT%H:%M:%S.%fZ"),
                      value=res)]
                )]
    )
)

# Get the data from response
print(post_metric_data_response.data)
If you see the above script, first I import the modules, get the configuration file to authenticate with OCI, and Initialize the service client with the default config file.. here replace the “service_endpoint” string with your endpoint. It would help if you were different as per your region.
After I connect to the database and execute a query to get the data.
Then I post the metric to the OCI monitoring service.

You can see above FRA free space is 99.99% free. and failed_metrics_count is also 0.
This means we successfully posted data to the OCI monitoring service.
Go to OCI –> observability & management –> Metric Explorer
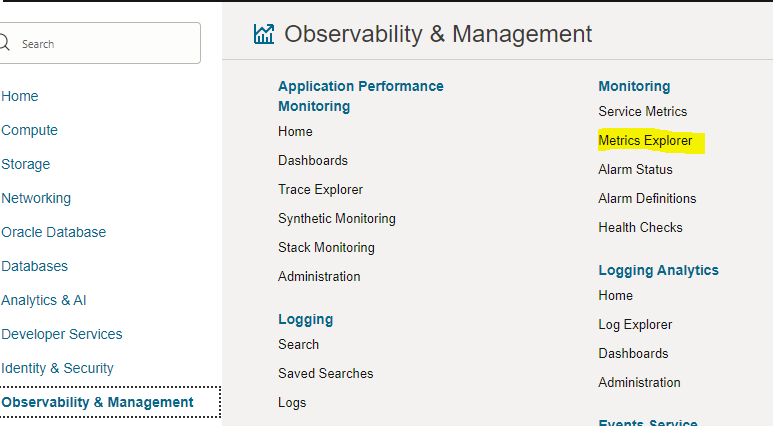
Provide the correct compartment, metric namespace, metric name, dimension etc. that you provided in the above Python Script and click update chart.
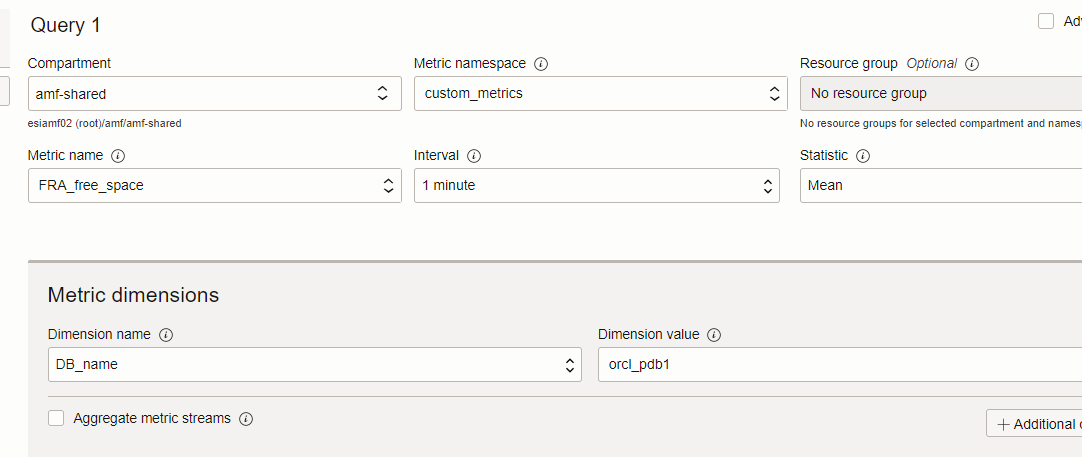
Now scroll up and enable show graph to see the values in OCI.

We can use crontab to schedule this Python script to post data into OCI.
# Example of job definition:
# .---------------- minute (0 - 59)
# | .------------- hour (0 - 23)
# | | .---------- day of month (1 - 31)
# | | | .------- month (1 - 12) OR jan,feb,mar,apr ...
# | | | | .---- day of week (0 - 6) (Sunday=0 or 7) OR sun,mon,tue,wed,thu,fri,sat
# | | | | |
# * * * * * user-name command to be executed
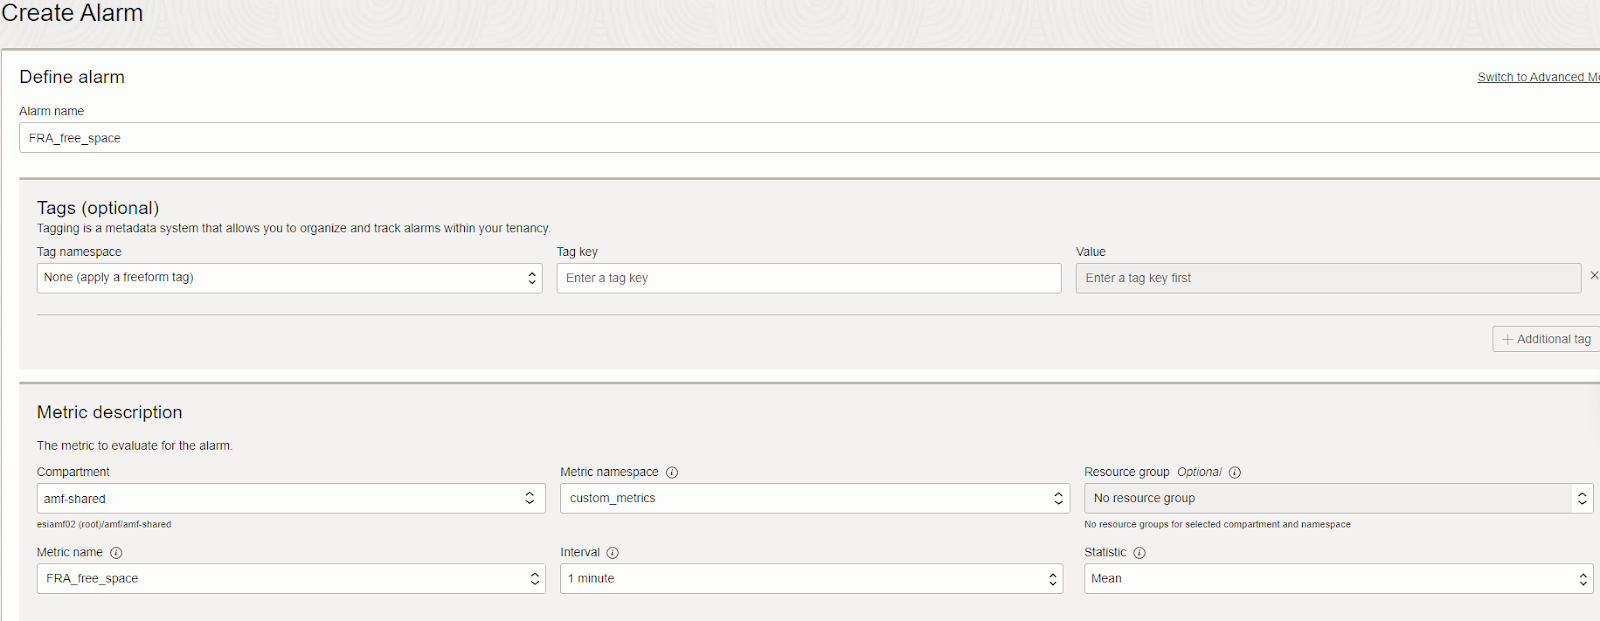
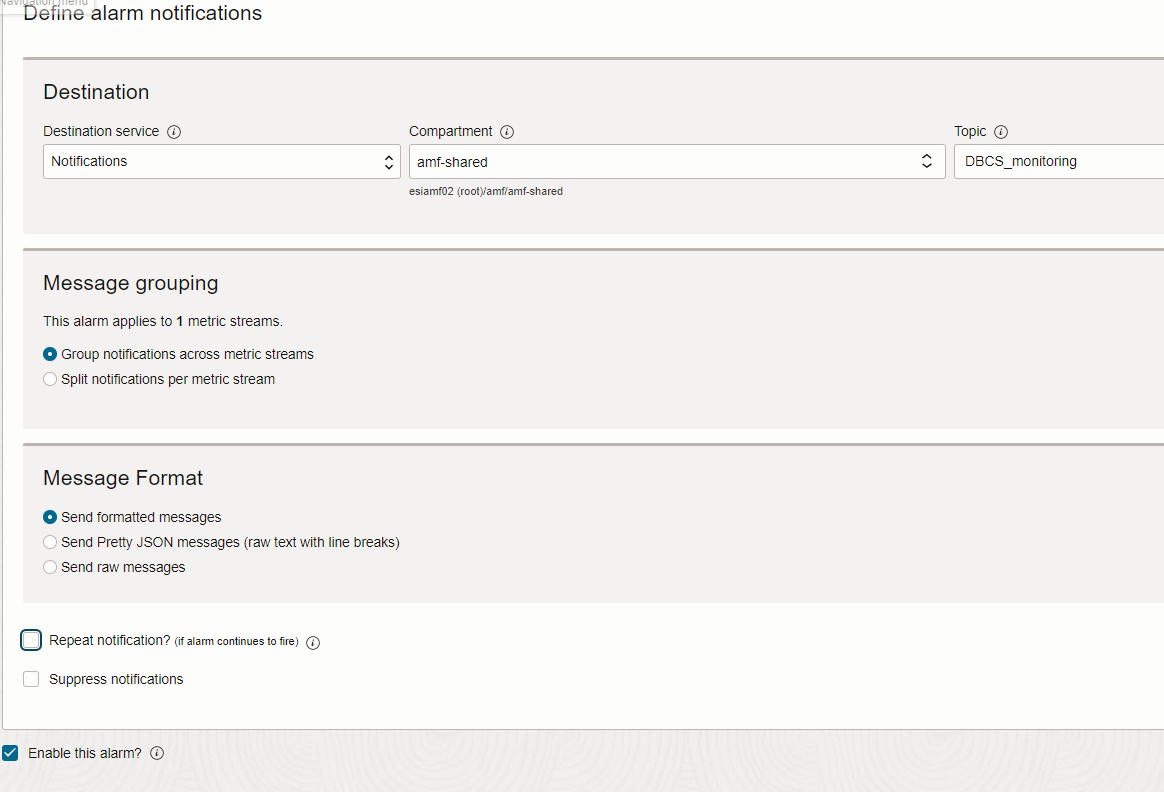
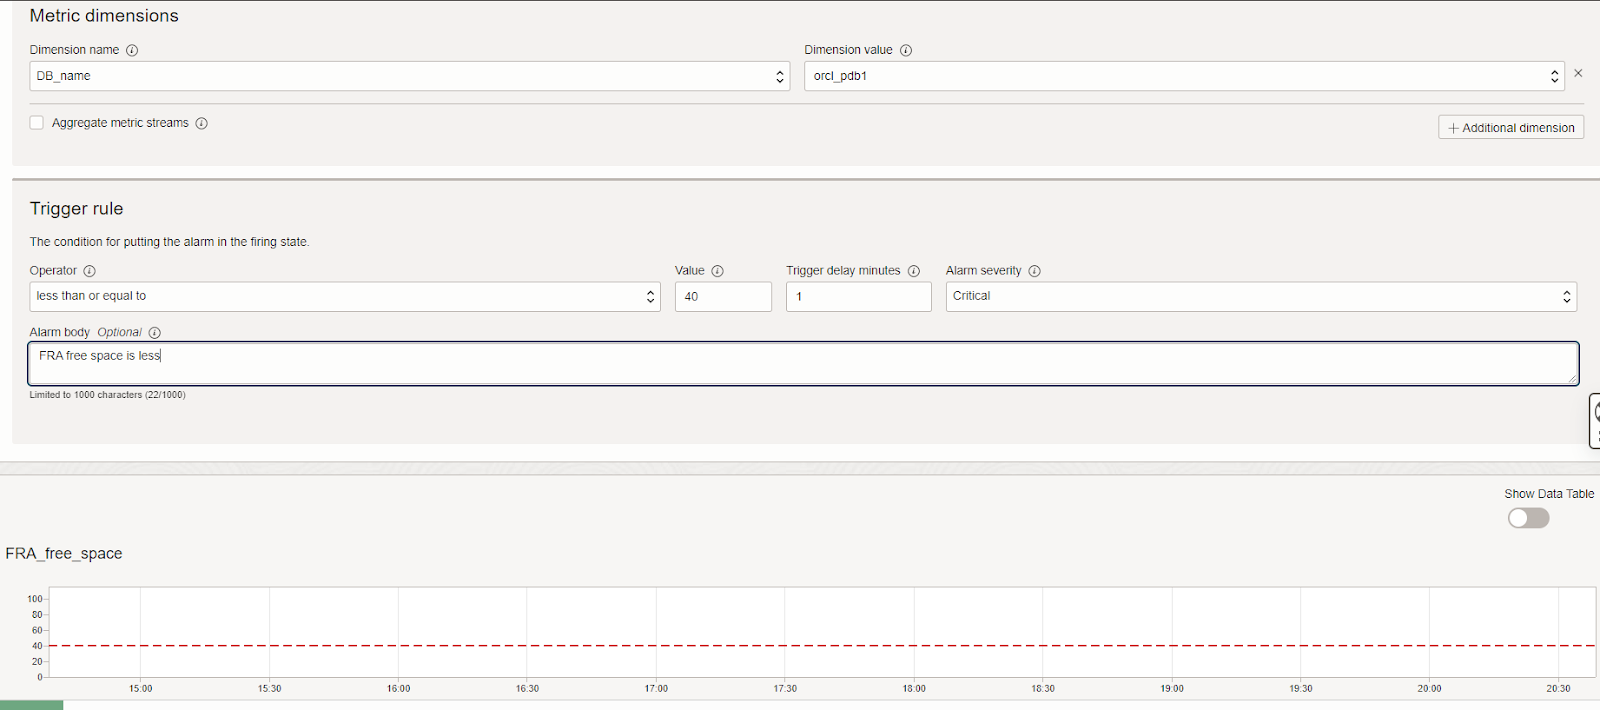
Click on save alarm and now you can see the Alarm is set and we will be notified as per threshold.

Thanks for reading!
In this blog, I will show you how to download and import the Image Gallery Plugin into OCI Oracle Analytics Cloud. using this plugin we can see ... Read More
OCI Document Understanding is an AI service that enables developers to extract text, tables, and other key data from document files through APIs and ... Read More